
The Furious Squeeze That Sent Nasdaq To Its Best Start In Over 20 Years, And Why Bears Are Really Sweating Now
Back on January 9, despite a wave of raging pushback (putting it mildly) as the consensus bearish call was dead certain that the bottom was about to fall out of the market – after all, who in their right mind would fight the Fed when the Fed has clearly telegraphed that it wants risk lower – we warned that “We Are Setting Up For A Tech-led Squeeze Higher As Shorting Gets Extreme.”
What happened next was a historic tech-led squeeze as shorts got steamrolled over and over, and every attempt to push stocks lower was met with furious dip-buying (mostly by retail) which pushed S&P futs above all key resistance levels (50DMA, CTA trigger, 200DMA, descending channel) which sent it to a two month high of 4,100.
The bear-capitulating result, as Goldman’s Michael Nocerino puts it in his latest market note (available to pro subs), is that with just two trading days left in the month, “the January effect has come to fruition as the SPX is +6.02% and NDX is +11.2%, making this Nasdaq’s best start in over 20 years.”
As shorts were squeezed – with Goldman’s most shorted basket rising 23% since our Jan 9 post…
… and as markets melted up, here is what the bank’s clients were focused on this week: i) the pull forward of a soft landing; ii) better than feared earnings so far; iii) reduction in wages; iv) declining dollar; v) light positioning; vi) CTA demand resurgence and vi), retail returning.
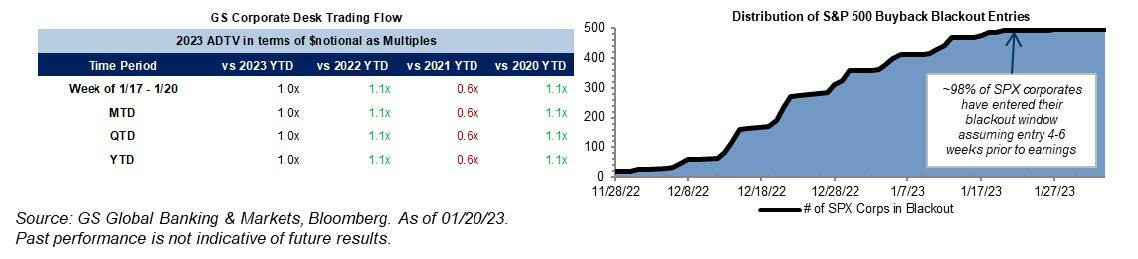
Most importantly, this all comes as corporate are starting to exit their buyback blackout window (more on this shortly).
To be sure, the recent trend can still reverse – especially since much of the “real $” is still waiting for the big earnings week ahead (and risking to miss the train entirely if the rally accelerates), and next Wednesday is the Fed, followed by GOOGL, AMZN, and AAPL reporting on Thursday (+12%, 22%, 12% on the year), which to Nocerino “feels like a set up for a fade, but with the caveat that investors are not “full” and retail and technicals continuing to fuel price action.”
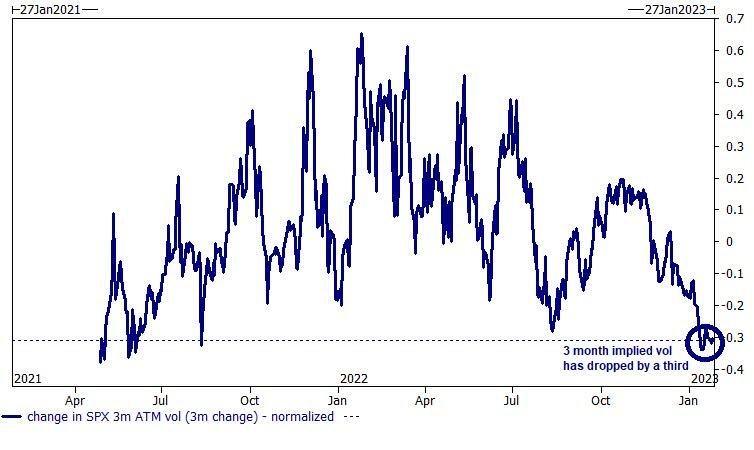
And speaking of technicals, the most important one by far this year, remains ever present. Here is how Goldman derivatives guru Brian Garrett describe market action 20 (long) sessions in 2023:
What we are talking about on the desk and seeing in markets 20 trading sessions down, and 232 trading sessions to go?
Bottom line… implied vols have retraced to 2 year lows and we yet not seen an increase in demand (in fact the desk has seen the opposite) …
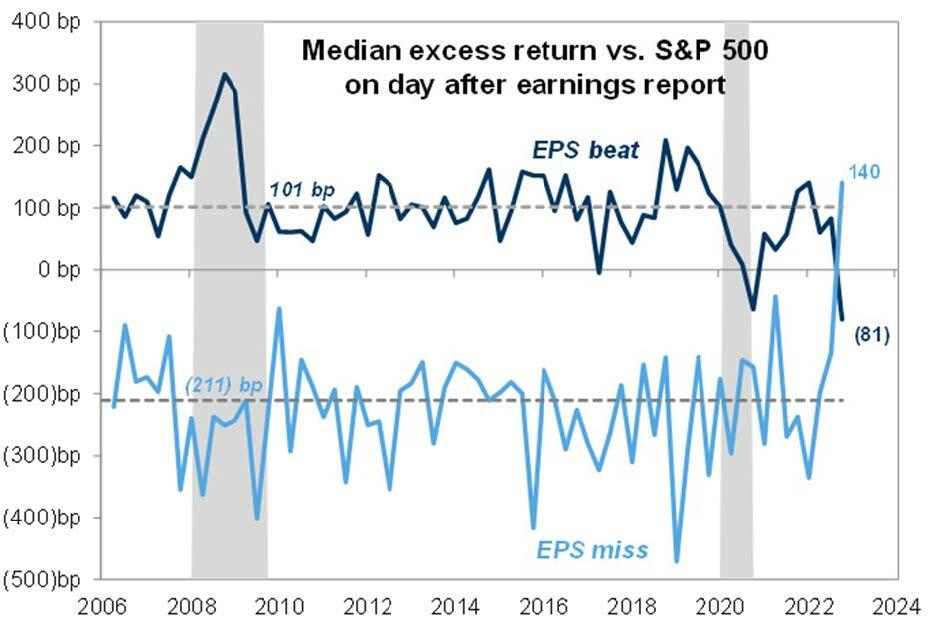
… correlation is breaking down as stocks behave like individual corporations and factor vol decreases (nothing shows this better than the earnings surprise miss/beat chart we showed previously – even if trading “wrong way”) …
… the rest of the world is decoupling from the US in terms of both absolute return and positioning (PM survey suggests this could keep going).
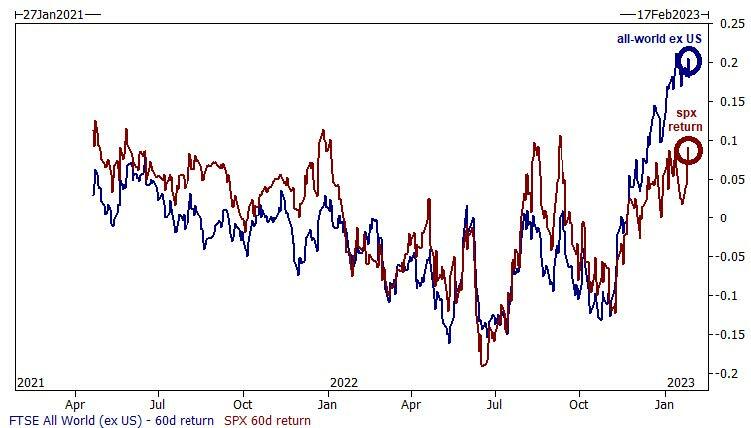
Garrett’s bottom line: “US stock exposures are not set up for a continued rally and one could argue that if this squeeze continues, there is no shortage of single stock positions that would need to be covered (ie: potential for early innings).”
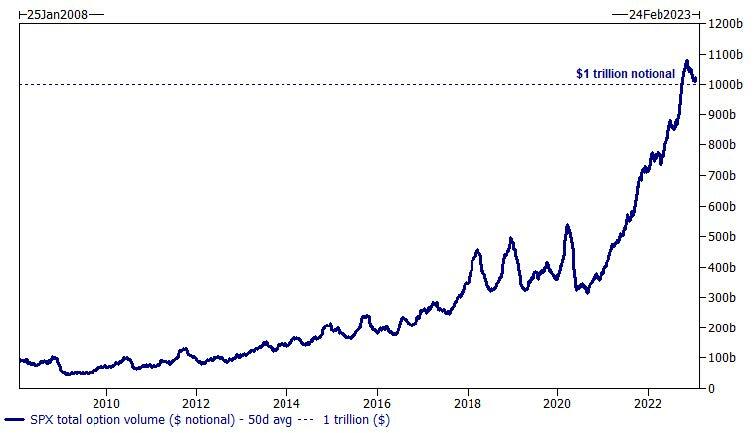
One final last chart from Garrett before we shift back to Nocerino, just because the numbers are – as the Goldman trader puts it, “staggering” – the 50 day average $ notional traded in SPX options is remains above $1 trillion.
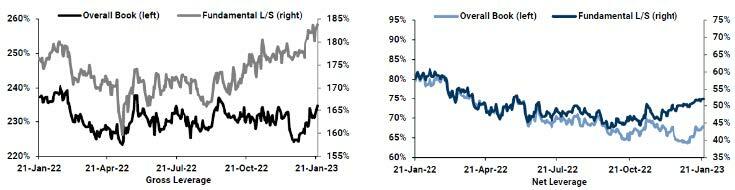
Meanwhile, for those who think that the shorts have had enough getting spanked and are finally covering, guess what: wrong. As Nocerino writes referencing the latest Goldman Prime data, “Gross and Net leverage for the overall Prime book increased on the week. Fundamental L/S Gross leverage increased while Net leverage finished slightly down.” Some more color:
Overall Prime book was modestly net sold, driven by risk-off flows with long sales outpacing short covers. Macro Products were net sold led by long sales, while Single Stocks were net bought for a 3rd straight week driven entirely by short covers. Hedge funds net bought Energy stocks amid continued optimism over China demand. Aggregate US Energy long/short ratio increased +3% week/week.
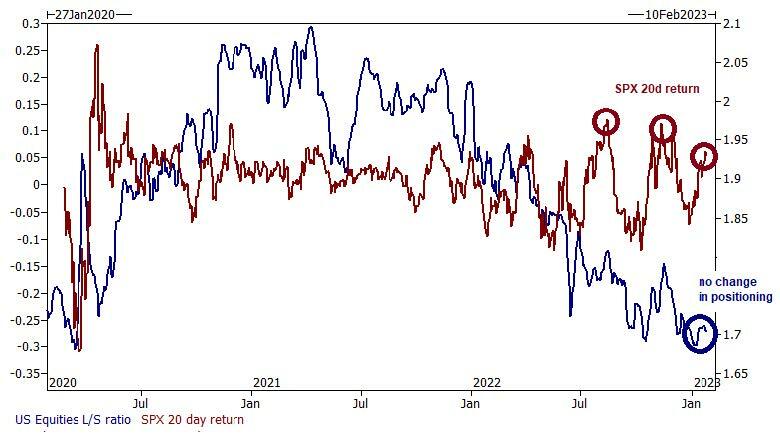
Ironically, so ingrained is the bearish mindset that pro investors would rather short any rip than buy any dip (that’s what retail has been doing for the past two weeks after 17 weeks of selling). As Brian Garrett states in his latest note, Positioning Remains Light, and notes that “the GS prime brokerage data shows that the professional investor community is not ready to chase this rally … chart below of the GS PB l/s ratio vs rolling SPX returns.”
And while this tactic served well in 2022, others at Goldman admit that everything has changed in just a few short weeks (see Goldman’s Biggest Bear Capitulates: “The Market Is In No Mood To Go Down Right Now“, Goldman Trader: Market Dynamics Have Shifted Dramatically Again, Here’s Why) and so institutions and hedge funds – who remain largely short – may soon be forced to chase the rally higher.
But it’s not just the relentless short squeeze that threatens the mental stability of bears (see Hartnett’s latest note: “Another 3-5% Will Feel Like Bathing In Lava If You’re A Bear“), there are many other bullish technicals on deck starting with…
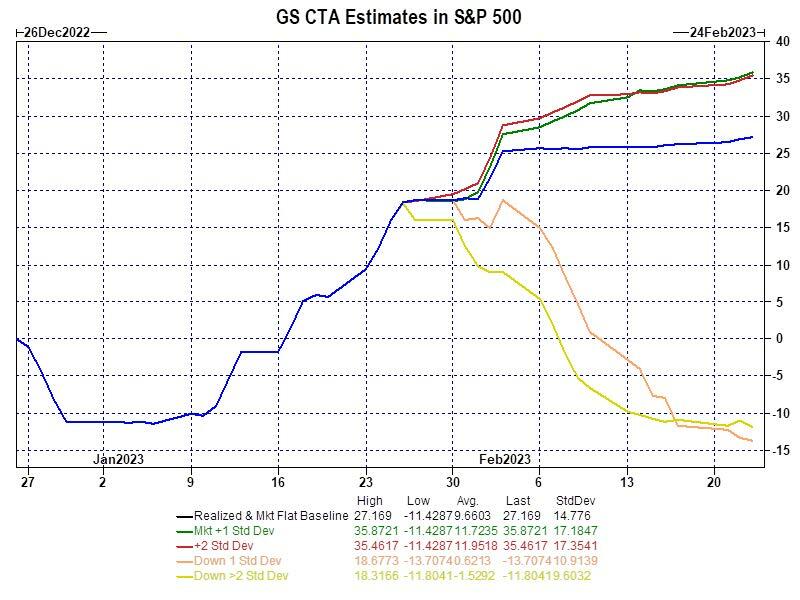
CTAs: here is some more in depth color from Goldman’s Futures Strats Desk: the recap is that Equity positioning is still to BUY, but demand slowing as positioning is getting full.
CTAs are at a 100% rank for positioning on a 1-yr scale within our work. That is to say that positioning is at the highest it’s been on a rolling 1-yr basis. To round out the week, we estimate CTAs bought $34bn of equities this week bringing the total positioning to long $91bn. Of the simulated buying, purchasing was heaviest in TOPIX ($13.6bn), followed by SPX ($12.5bn), with continued N. America buying in other products like RTY and TSE. SPX has rebalanced decidedly long in our work where we now estimate CTAs are long $9.1bn. N. America, however, has not yet caught up to EMEA, which holds its title for heaviest long in our model.
Flows scenarios over the next week:
- Baseline (flat prices and vols): $20bn of which 4.6bn is SPX, $11.2bn in TOPIX, $2.5bn in Nasdaq
- Prices up 2s and vol down: $17.78bn of which $5.4bn in SPX, $11.7bn in TOPIX, $2.5bn in Nasdaq
- Prices down 2.5s and vol up: -$14.4bn of which -$8.0bn SPX, +$5.0bn in TOPIX, -$3.4bn in FTSE
Threshold Levels (short/medium/long): SPX: 3937/3970.5/4073 … RTY: 1830/1841/1954
EARNINGS…As we first discussed last Thursday in “When Stocks Don’t Go Down On Bad News, That’s A Bullish Signal“, when the market/stocks dont go down on bad news (MSFT guide) typically a bullish signal. As Goldman wrote then, “we learned a lot from this price action today: this market is more resilient than most of us are giving it credit for (be very thoughtful/selective with your short positions as squeezes will be common this Q).” To this, Nocerino adds that we have been seeing weaker report being bought (ie: MSFT). And as we pointed out on Friday, “companies who miss earnings on EPS have outperformed at the largest pace on record.” Hardly a bearish signal.

BUYBACKS…Needless to say, this is the most important driver as we exit buyback blackout. We will have more to say on this shortly, but as Goldman calculates, the current blackout window ended Friday and the bank estimates that ~23% of the S&P 500 will be in open window. When the window is open Goldman estimates ~$4B/day in demand.
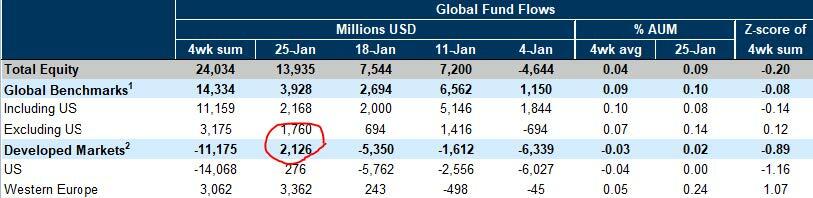
WHERE IS THE MONEY FLOWING… Net flows into global equity funds accelerated in the week ending January 25 (+$14bn vs +$8bn in the previous week)…a lot of this comes in Emerging Mkts, but importantly the outflows out of US turned positive and money market fund assets declined by $2bn.
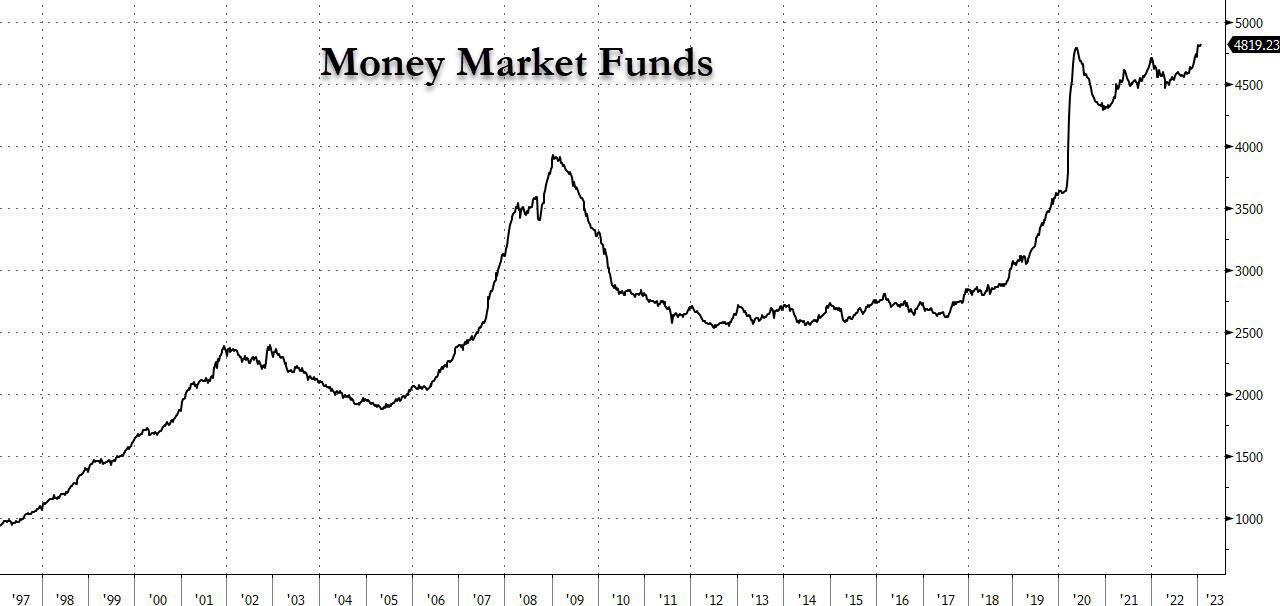
Meanwhile, Money Market Funds just hit a new all-time high cash level. As Goldman points out, “5% cash yields make the bar higher for a re-allocation to risk assets; but if the Fed’s done, the incentive to reallocate is done.”
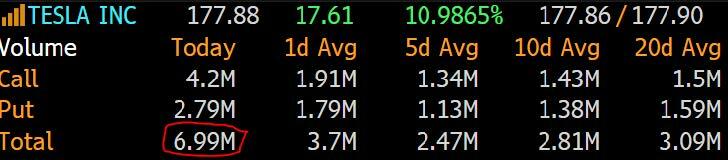
RETAIL…Last but not least, retail is back in full force and after selling for 17 straight weeks, retail investors have been buying aggressively for the past two. Here’s a good example: TSLA now accounts for roughly 7% of all options trading on an average day, with nearly 3mm contracts changing hands on an avg — up from 1.5 million a year ago and more than any other stock (WSJ). TSLA gained +33% last week, its best week in >10 years, largely thanks to an epic retail-driven gamma squeeze.
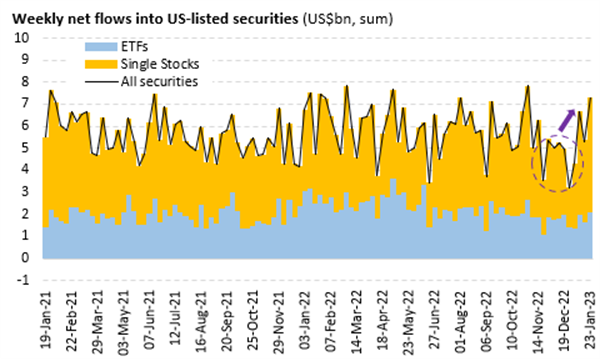
And as Vanda Research adds, “retail investor appetite returns as stocks recover from last week’s slump. Indeed, retail flows remained resilient and continued ticking higher, helping broad indices recover from a two-day dip last Wednesday and Thursday. Moreover, with the earnings calendar getting busier and some of retail’s favorite names beating expectations, flows into single names have kept climbing. The two charts below depict these dynamics, with the average daily inflow across all securities rebounding toward US$ 1.2bn/day…
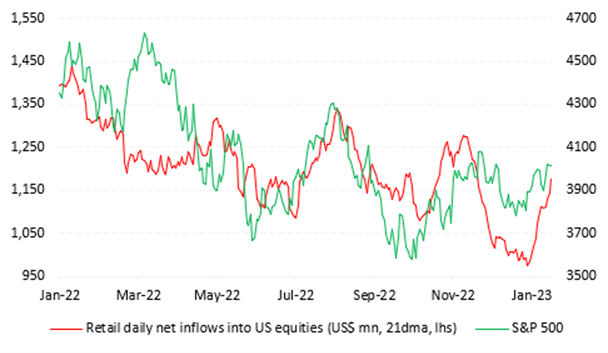
… and with full-week flows into single stocks estimated to approach ~US$ 5.3bn.
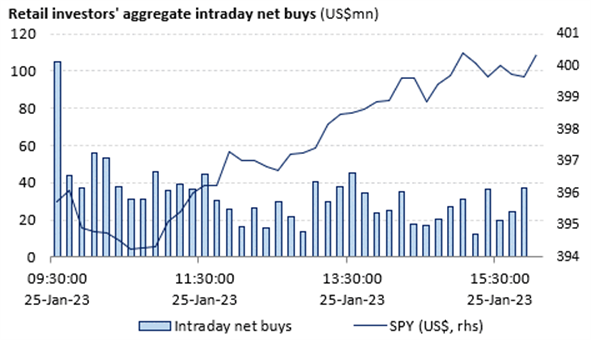
Moreover, intraday action shows that retail traders gave a needed hand to US stocks after the initial dip post MSFT earnings. Beyond the usual flurry of buying at the open, retail crowds leaned against downward pressure on stocks – all of it coming from institutions – for the entire first two hours of trading while adding extra support on the way up in the early afternoon as well
Bottom line: if retail is once again a more powerful price setter than institutions and hedge funds (thank you zero market liquidity), and we are facing another Jan 2021-type meltup, then watch out above even if none of the abovementioned technicals go into play.
More in the full note available to pro subs.
Tyler Durden
Sun, 01/29/2023 – 20:00
From:Zerohedge